In a 2013 study, Vanichvasin found that most students agreed that infographics could enhance appeal, comprehension, and retention of what was being taught. Students also held a highly positive attitude towards the use of infographics as a learning tool. They are a visual aid in processing information. They tend to make information more visually appealing, easier to understand, and should be easy to decipher. The BC grade 12 curriculum now requires students to create a visual representation of information. In order to incorporate these aids into your classroom, it must first be determined whether the teacher, students, or both will be the creators. There are a number of platforms available to create visually stunning designs. The following top platforms were evaluated using the Bates (2008) SECTIONS model in order to make a recommendation for BC teachers seeking to have their high school students create infographics.
/ |
Canva www.canva.com/ |
Visme visme.co/ |
Infogram infogram.com/ |
Piktochart piktochart.com/ |
|
Students |
Ability to login with Google or create a new account. There is also a native app for Android and iOS. Very accessible for students on any device. Enterprise accounts are available for extra costs that can be used as classroom "teams" |
Able to sign in with Facebook or create a new account. There is no app for Andoid or iOS, limiting access for some students. Creating a new login or using a Facebook ID could be a barrier to consider. |
Able to login with Google or Facebook, but must have a login. There is no English language App for Android or iOS, limiting access for students. |
Able to login with Google or Facebook, but a login is required. There is a Chrome extension for users but no native apps for Android or iOS, limiting access for some students.. |
Students can login using their Gmail accounts. Can be integrated into Google Classroom. Editable on any platform. No iOS or Android compatibility. Enterprise accounts available for extra cost. |
Ease of Use |
Collaboration is asked for from the beginning. Very simple to use templates, easy customization, common keyboard shortcuts do work. An initial guide is also provided to get users started. Charts and graphs are not easily made. Educational blogs available on website. Creations are easily downloaded. |
Easy to use templates, but changing them requires a little more work, things such as adding columns or resizing is very manual. Common keyboard shortcuts do not work. Creations are easily downloaded |
No templates to choose from other than the original template for the first page. Adding charts, pictures, text, and maps are easy. Infographic size is preset and not easily changed. Limits the total number of graphic downloads available for free accounts. |
Easy to customize, change colours, how-to videos readily available. Common keyboard shortcuts do work. Educational blogs available on website along with online, real-time support (paid subscription only). Files can be downloaded in PNG format at medium quality for free accounts. |
Familiar setup to those who have used Microsoft Publisher. Collaboration available but not necessary. Guide and blogs allow users to get started. Full drag-and-drop capability. Download of images is available for free. |
Costs |
Free includes collaboration with up to 10 people, image storage, 8000 templates, and a pay-to-use library of templates and images beginning at a cost of $1 USD each. $12.95/user/month increases collaboration to 30 people, increases storage, but many features are not relevant to education. Enterprise version available by quote only. Team administrative controls and a dedicated account manager. |
Free limits users to only three projects and a limited number of templates. To get all templates and images starts at $10/month/user. A classroom account starts at $150/semester and includes 30 people. |
The free options allows up to 10 projects, 37 chart types, but limits images, privacy and analytics. Pro starts at $19/month/user giving access to many more pictures, privacy, and unlimited projects. |
Unlimited projects on free version, but limit on number of templates. Educational license options begin at $39 USD/year for an individual license and $120 USD/year for a classroom consisting of 30 student and one teacher account. |
Free basic account for students and teachers but limited to one user, no teacher-controlled environment, 10 document limit, 100MB storage, no Google Classroom integration. Paid accounts are by quote only but unlock all the features above along with unlimited limits on documents and storage space. |
Teaching Functions |
Wide range of templates and tools available to create infographics. Allows embedding and sharing of graphics onto class websites. |
Ability to createpresentations, infographics, reports & ebooks, printables, web graphics, social graphics, and custom media. Meets the desire of making visually intensive media. |
Ability to create infographics, reports, dashboards, facebook posts, charts, and maps. Does meet the need of creating visually intensive media. |
Beyond infographics both presentations and printables can be made. There is no ability to work on one project with a group built in. Does meet the stated need of creating visually intensive media. |
Full desktop publishing ability. Can be used to create infographics along with other applications. Media can be embedded into documents. Meets the need of making visually intensive media. |
Interactions |
Student-student interaction is easily facilitated online through collaboration. Teacher-student collaboration is also available when using "Canva for Work" and Enterprise versions. |
Interactions only occur when sharing projects, there is no peer or teacher interaction that can be accomplished online. Face-to-face interaction is possible with those involved sharing a single device. |
Without paying for a $149 team account, there is no interaction within the platform beyond sharing a finished project or a snapshot of an ongoing project. |
Interactions are scarce. Students can share their creations with peers, but can not collaborate. Likewise teachers only have access to what is shared as a finished project or snapshot of an ongoing project. Full collaborative features only unlocked when using paid subscriptions. |
Collaborative features require a paid account following the 30-day trial. With paid subscription, interaction possibilities are endless with students sharing and working on the same project across various devices and platforms. |
Organizational Issues |
Potential issues include cloud storage, collection of student information, software beyond what is approved. For many organizations these are minor issues but must be addressed. Any guest invited to collaborate must create a Canva account or link to their social media account. |
Potential issues include cloud storage, collection of student information, software beyond what is approved. For many organizations these are minor issues but must be addressed. |
Potential issues include cloud storage, collection of student information, software beyond what is approved. For many organizations these are minor issues but must be addressed. |
Potential issues include cloud storage, collection of student information, software beyond what is approved. For many organizations these are minor issues but must be addressed. Any guest invited to collaborate must have a Piktochart account and be part ot the classroom or have their own paid subscription. |
Potential issue is cost as any subscription expires after 30 days. When purchased, students can use their Google account worry-free. |
Networking |
Facebook and Twitter have built-in sharing enabled. Ability to share a link or embed as well. |
A link to the created media is shareable on social media or other electronic formats, but it is not integrated into the platform. |
Social media site sharing is built into this platform, making it very easy to share what you have created. |
A link to the created media is shareable on social media or other electronic formats, but it is not integrated into the platform. |
Social media site sharing is built into this platform, making it very easy to share what you have created. |
Security and Privacy |
Privacy and security linked to Gmail, perfect for schools using G Suite applications. Not Children’s Online Privacy Protection Rule (COPPA) compliant. Users must be a minimum of 13 years old to use the application. Canva retains ownership of materials created using free account. |
Privacy is dependent on the information a student originally provides. Beyond this information, no other personal or sensitive information will be posted or used within this platform. Not COPPA compliant |
Privacy can be made dependent on the Gmail account associated with the platform. Many students already have a separate Gmail for Google Classroom purposes that may be deemed appropriate to use. No other personal information or sensitive information is posted in or asked for when using this platform. Not COPPA compliant |
Privacy can be made dependent on the Gmail account associated with the platform and whether account if free or subscription. Many students already have a separate Gmail for Google Classroom purposes that may be deemed appropriate to use. No other personal information or sensitive information is posted in or asked for when using this platform. Not COPPA compliant. |
Privacy is protected through purchase of license. While not COPPA certified, the protection of material and integration of Google Classroom enables Lucidpress to be more of a host for created work rather than a platform with ownership of created materials. |
Depending on the particular class and the needs of the students, there are potentially two recommendations from this comparison. Canva's free version is the most template rich, easy to use, and readily available platform for students and includes collaboration. However, maps and charts are not able to be created in this platform and would require a separate upload. If these are necessary, Piktochart is an excellent choice and is the only other platform above that offers unlimited projects. Collaboration would need to be face-to-face or require a separate app, such as those evaluated on the next page.
The program that best fits our needs is Canva. It is a program that has gained much popularity recently. Founded in 2012, it is a web-based freemium application that allows users the opportunity to create graphic-based works. Some examples of items that can be created using Canva include logos, banners, desktop backgrounds, letterheads, and infographics.
These infographic tools are a great way to have students demonstrate their learning in a visually appealing way. Whether it is showing the progressing plot of a story, the way in which to apply formulas, or explaining photosynthesis student creations will quickly demonstrate whether or not they understand the concept. These creations are great for students' own review and can be shared with peers and other classes. With Canva's support for group collaboration, group work is also simple to organize. There are many possibilities for both teachers and students to create and utilize infographics at school. Below is an example of how a student collaborated at her school.
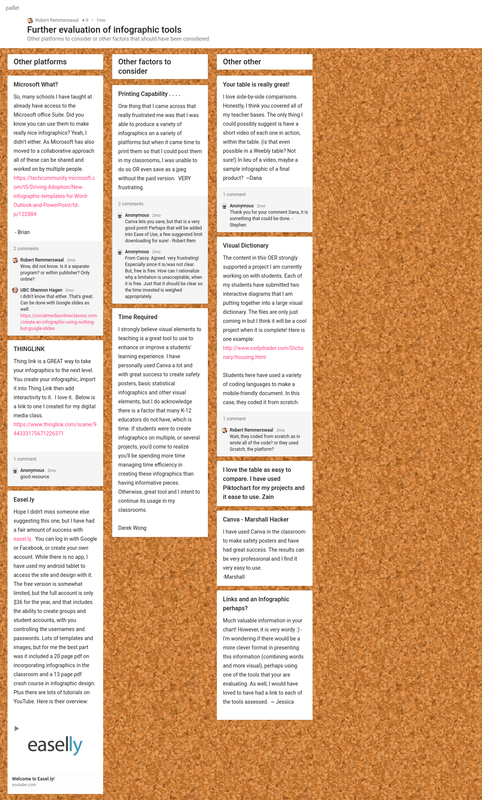
The 2018 cohort provided a few suggestions and other ideas within the infographic space. Some suggestions have been implemented into this site. Take a look at the Padlet below for more ideas and feel free to post ideas of your own.
Infographic tools, like Canva, can have a way to collaborate with other students. When these tools aren't built in or are not meeting the needs of students, there are now tools that allow collaboration related to almost any digital media. Try the exploration activity on the next page and then proceed to learn more about Collaboration.
